
Google releases mobility report that tracks residents including Lenoir, Greene and Jones County
Photo: google.com
From Google reports:
See how your community is moving around differently due to COVID-19
As global communities respond to COVID-19, we've heard from public health officials that the same type of aggregated, anonymized insights we use in products such as Google Maps could be helpful as they make critical decisions to combat COVID-19.
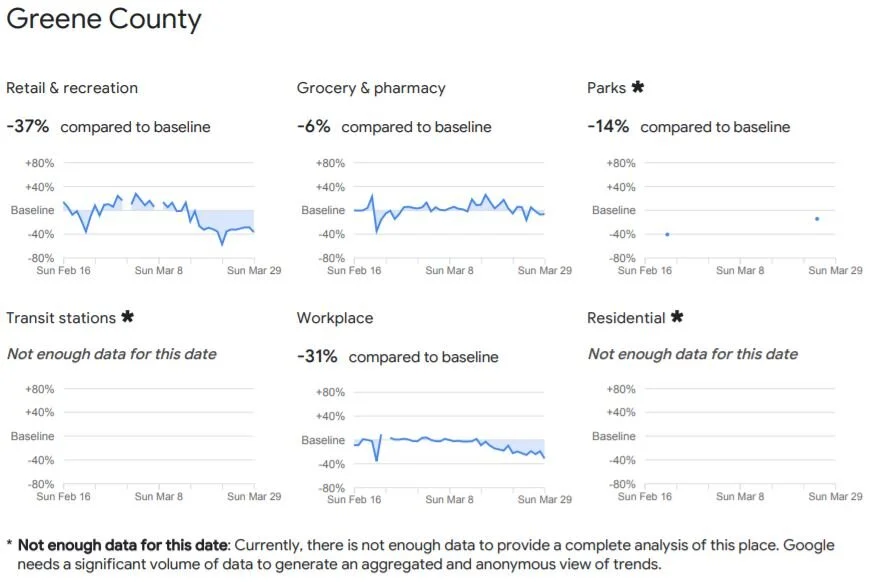
These Community Mobility Reports aim to provide insights into what has changed in response to policies aimed at combating COVID-19. The reports chart movement trends over time by geography, across different categories of places such as retail and recreation, groceries and pharmacies, parks, transit stations, workplaces, and residential.
What’s a Community Mobility Report?
Each Community Mobility Report is broken down by location and displays the change in visits to places like grocery stores and parks.
We’re working to add more countries, regions and languages in the coming weeks. This is an early release and reports will be updated regularly.
Mobility changes Google prepared this report to help you and public health officials understand responses to social distancing guidance related to COVID-19. This report shouldn’t be used for medical diagnostic, prognostic, or treatment purposes. It also isn’t intended to be used for guidance on personal travel plans. Location accuracy and the understanding of categorized places varies from region to region, so we don’t recommend using this data to compare changes between countries, or between regions with different characteristics (e.g. rural versus urban areas). We’ll leave a region out of the report if we don’t have statistically significant levels of data. To learn how we calculate these trends and preserve privacy, read About this data.
About this data
These reports show how visits and length of stay at different places change compared to a baseline. We calculate these changes using the same kind of aggregated and anonymized data used to show popular times for places in Google Maps. Changes for each day are compared to a baseline value for that day of the week:
The baseline is the median value, for the corresponding day of the week, during the 5- week period Jan 3–Feb 6, 2020.
The reports show trends over several weeks with the most recent data representing approximately 2-3 days ago—this is how long it takes to produce the reports.
What data is included in the calculation depends on user settings, connectivity, and whether it meets our privacy threshold. If the privacy threshold isn’t met (when somewhere isn’t busy enough to ensure anonymity) we don’t show a change for the day.
We include categories that are useful to social distancing efforts as well as access to essential services.
We calculate these insights based on data from users who have opted-in to Location History for their Google Account, so the data represents a sample of our users. As with all samples, this may or may not represent the exact behavior of a wider population